Dashboard controls
Dashboard controls appear on all dashboards and allow you to apply specific actions to the dashboard.
Dashboard controls apply to the entire dashboard. Individual tiles also have controls. See Tile actions for more information.

Reload

You must manually update your dashboard anytime you change filter settings.
The icon appears blue when you’ve selected one or more filters but have not applied them (aka – the selected filters and data in the dashboard aren’t in sync). The icon appears gray when selected filters and dashboard data are in sync.
Every time you click Reload, your results are cached to improve data load times as you apply additional filters. See Clear cache and refresh for more information.
Show/Hide filters

Hide the filters to increase viewing space for your dashboard data. Click the button again to show the filters.
Open folders

If you have customized dashboards, this is where they’re saved.
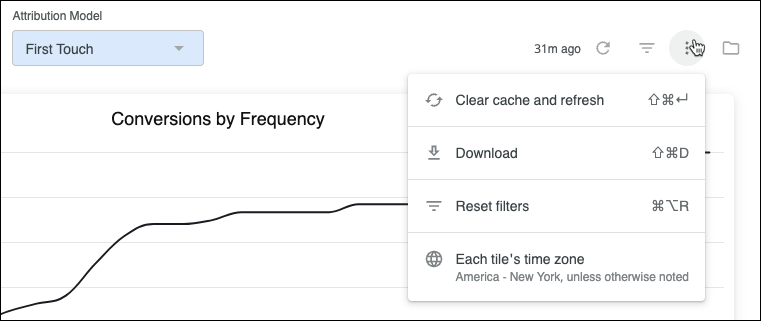
Dashboard actions menu
The actions are available in the dashboard’s menu.

Clear cache and refresh (dashboard)
Every time you apply a filter, your results are cached to improve data load times as you apply more filters. If you’re experiencing any issues with data load or page performance, select this option to clear your cache and start fresh.
Download
Download your dashboard as a PDF or CSV file. See Download dashboards and metrics from Peacock Ad Manager for detailed information.
Reset filters
Remove all applied filters from your dashboard and return to the default dashboard view. You don’t have to click Reload to apply the change. Your dashboard will update using the default settings.
Each tile’s time zone
The time zone the data is reported in. Click to change the time zone.
