Skip table of contents

Prebuilt reporting dashboards in Peacock Ad Manager

Peacock Ad Manager provides the following prebuilt reporting dashboards:

  • Campaign Delivery shows the overall ad spend for your campaigns over time. 

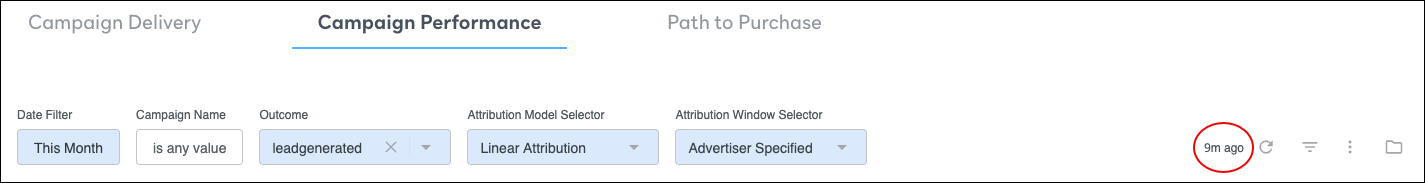
  • Campaign Performance shows relevant performance data (e.g., conversions, installs, etc.) and spend by day for your campaigns over time.  

  • Path to Purchase shows the touchpoints your customer took throughout your campaign. 

  • CPA Optimization This report is available only for CPA-only clients. This report shows relevant performance data (conversions, spend, revenue, and ROAS), and a chart illustrating conversions, purchase value, and client spend over time. 

Campaign Performance and Path to Purchase reporting dashboards require tracking pixel implementation. See Measurement for details on setting this up. 

Reporting data is updated approximately every four hours, and the dashboards reflect the last time the data feed was updated. 

image-20240626-180041.png

Dashboard layout 

All prebuilt dashboards have three main elements: 

image-20240626-180310.png

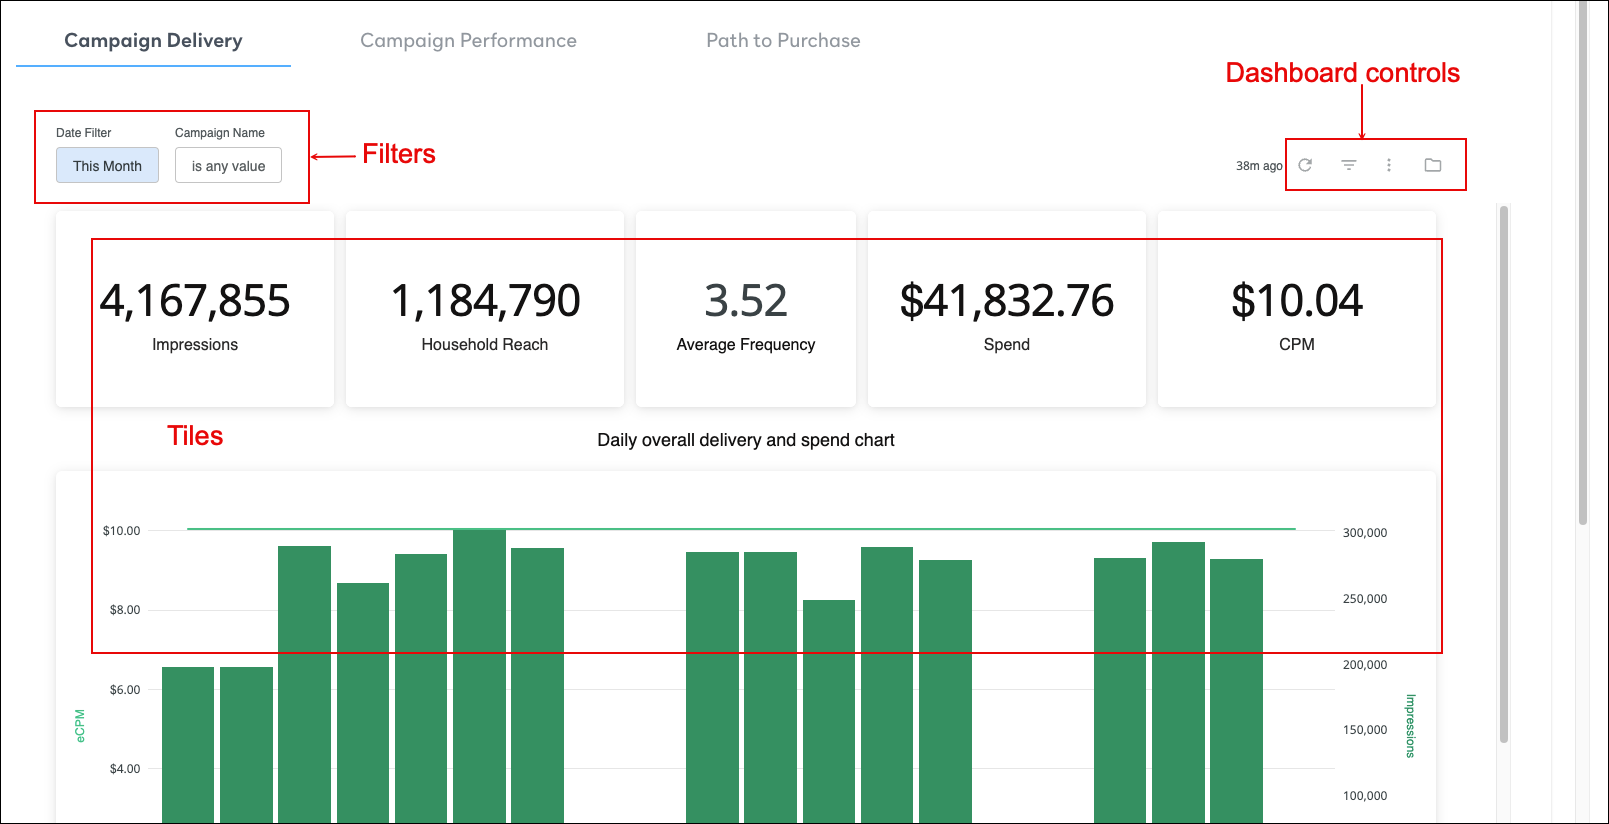
Important information about dashboard filtering 

The prebuilt dashboards in Peacock Ad Manager provide a quick, high-level view of your data using basic filter settings. You can adjust filter settings to view the desired data. Dashboard filters apply to the entire dashboard.

Individual tiles on the dashboard may have additional filters already applied that aren’t readily visible on the dashboard. For example, on the Path to Purchase dashboard, the Attributable Outcomes tile is filtered to show unique households only, even though the Is Unique Households filter isn’t visible in the filter bar. 

To view active filters applied to a metric tile, in the tile controls, click image-20240607-185728.png > Explore from here and expand the Filters pane. 

Default filter selections vary by advertiser and are specified during account setup.

About the Campaign Delivery dashboard 

The Campaign Delivery dashboard in Peacock Ad Manager shows the overall ad spend for your campaigns over time.

campaigndelivery.png

Filters

Key metrics

Chart

Detailed metrics tables 

  • Date range 

  • Campaign name

The graph shows the daily overall delivery (impressions) and spending (eCPM) for your campaigns over time.  

View detailed delivery metrics for the following categories: 

  • Campaign name 

  • Ad groups 

  • Creative 

  • Day of week 

  • State 

  • DMA 

About the Campaign Performance Dashboard 

The Campaign Performance dashboard in Peacock Ad Manager provides a high-level overview of a campaign’s overall health, including key metrics and a cost per conversion and spend chart.  

image-20240626-183745.png

Filters

Key metrics

Chart

Detailed metrics tables

  • Date range  

  • Campaign name 

  • Outcome

(warning) You can select only one conversion event from this filter. To view metrics for multiple conversion events on the same report, create a custom dashboard.

  • Attribution model 

  • Attribution window  

The graph shows the cost per conversion (both within and outside of the attribution window) and total spend per day for your campaign over time.  

View detailed performance metrics for the following categories: 

  • Campaigns 

  • Ad Groups 

  • Creatives 

  • Daypart 

  • State 

  • DMA 

About the Path to Purchase Dashboard 

The Path to Purchase dashboard in Peacock Ad Manager provides detailed information about the touchpoints your customer took throughout your campaign.

image-20240626-184748.png

Filters

Key metrics

Chart

Detailed metrics tables

  • Date range 

  • Campaign name 

  • Outcome  

  • Attribution model 

  • Attribution window 

  • Conversions by Frequency 

  • Conversions by Time 

  • Time Decay 

View detailed metrics for the following: 

  • Order list for selected outcomes 

  • Customer journey for all outcomes 

About the CPA Optimization dashboard 

The CPA Optimization dashboard is for CPA-only clients. This dashboard provides insights into campaign performance by providing relevant performance data (conversions, spend, revenue, and ROAS) and a chart illustrating conversions, purchase value, and client spend over time. 

image-20240718-130955.png

Filters

Key metrics

Chart

Detailed metrics tables

  • Date range 

  • Contract 

  • Outcome 

  • Customer status 

✅ Default filters are applied, but you can change these values.

Conversions by Outcome Date 

Detailed metrics are available for the following categories:

  • Events by day 

  • Performance by creative 

  • Performance by channel 

  • Performance by state 

  • Order list 

  • Customer journey 

JavaScript errors detected

Please note, these errors can depend on your browser setup.

If this problem persists, please contact our support.